ECG morphological analysis
In this tutorial you will learn how to use PhysioZoo ECG to engineer morphological ECG biomarkers and export their values.
Introduction
An electrocardiogram (ECG) is a simple test that uses temporary electrodes on the chest and limbs to monitor, track, and document the heart’s electrical activity. The ECG provides information about the function of the intracardiac conduction system, which is responsible for generating and propagating electrical impulses through the heart. The ECG records the sequence of depolarization and repolarization of the atria and ventricles, which are represented by different waves on the ECG.
Studying the morphological characteristics of the ECG may provide information on underlying physiological heart conditions. PhysioZoo ECG provides a framework and tools for extracting morphological biomarkers from the ECG signal.
Performing ECG morphological analysis
Start by entering the ECG interface by clicking on the ‘Pulse’ menu on the top left, then load some ECG example by clicking File -> Open data file -> Human_example_ecg_12_leads_short.txt. The program will automaticly present the ECG file you imported.
To perform the analysis, please follow the instructions:
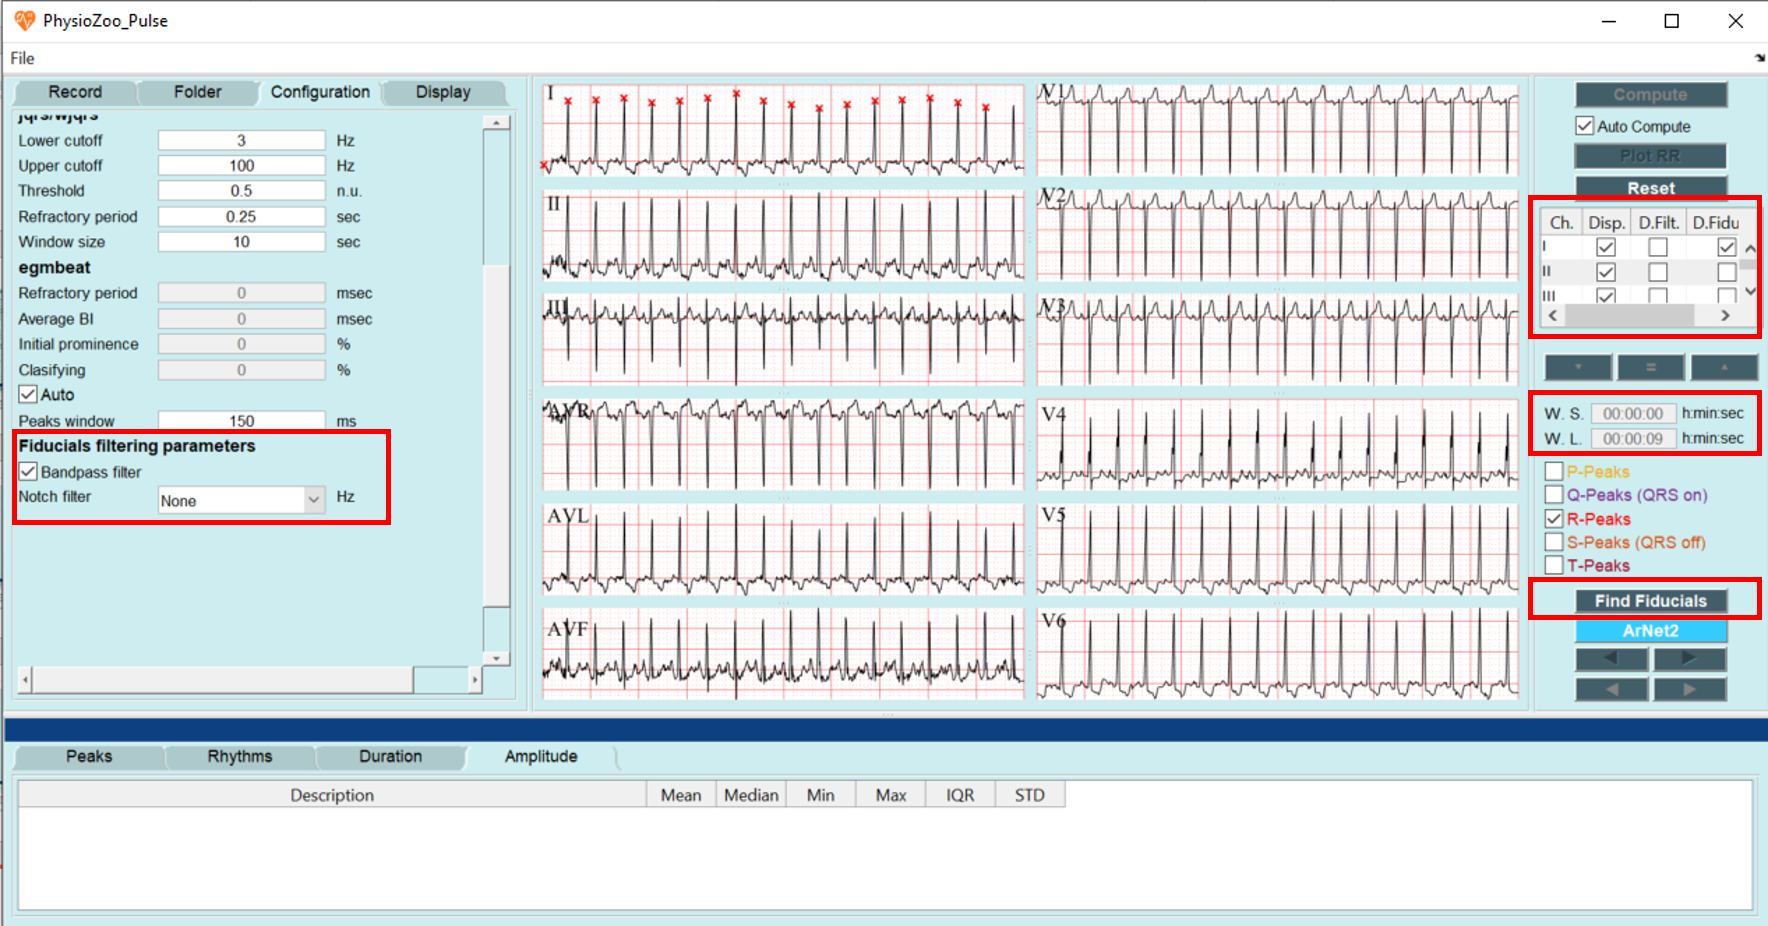
Prefiltering the signal: On the left panel, select the “Configuration” tab. On the bottom of the tab, you will find a section labeled: Fiducials filtering parameters which refers to two filters applied to your signal before analysis:
The bandpass filter in the range of [0.67,100] Hz. Its purpose is to remove the baseline wander and high frequency noise. Check the box labeled Bandpass filter if you want to use it
The notch filter. Its purpose is to remove the powerline interface. If you want to use it, choose the frequency of the powerline interface of the country where the ECG was recorded.
Definition of the window for anlysis: On the right panel, define the W.S. (start of the window) and the W.L. (length of the window) you want to analyze. You can analyze all of your signal or part of it. Note that if you analyze a long window,it may take some time.
Visualization of multiple leads: Choose the leads you want to visualize and the leads on which you want to plot the fiducial points (the fiducials points are calculated using the wavdet algorithm).
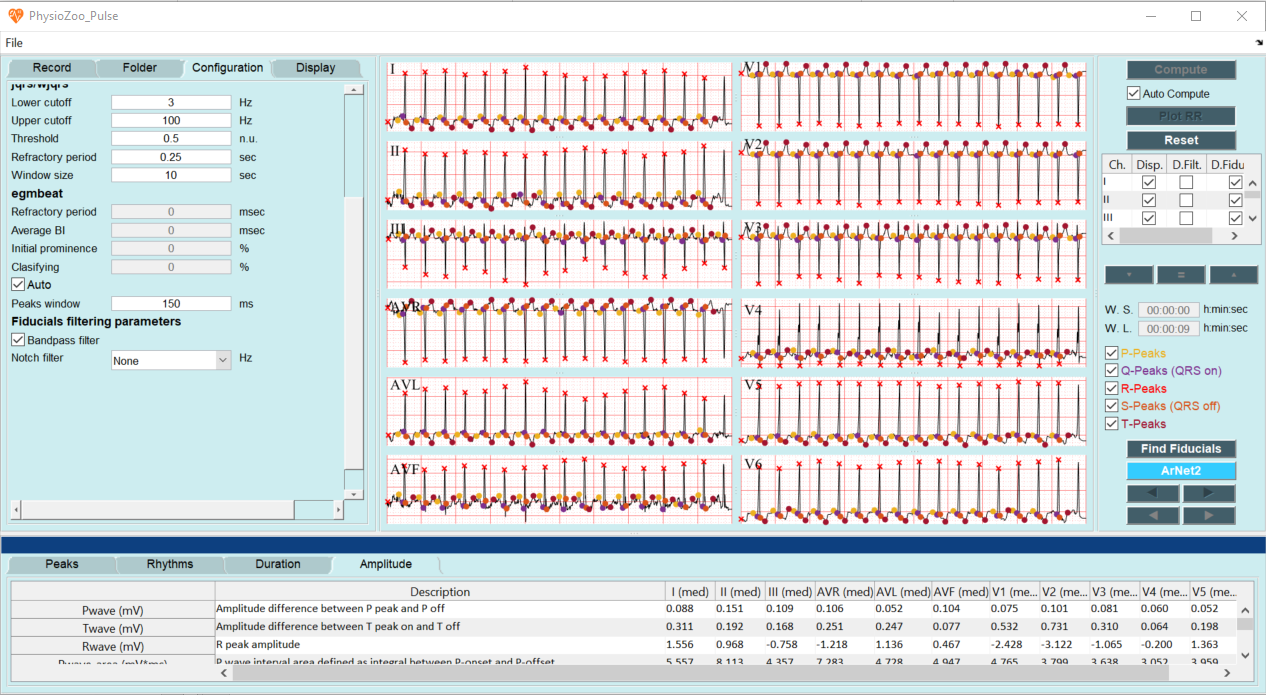
Click the Find Fiducials button. The fiducial poits will be detected and highlighted while the biomarkers will be automatically engineered and displayed on the lower pannels.
Congrats! You have made your first morphological analysis with PhysioZoo ECG! The biomarkers are divided into two different categories: Duration and Amplitudes, the statistical measurments of the biomarkers will be presented in a table, in the bottom panel.
Note
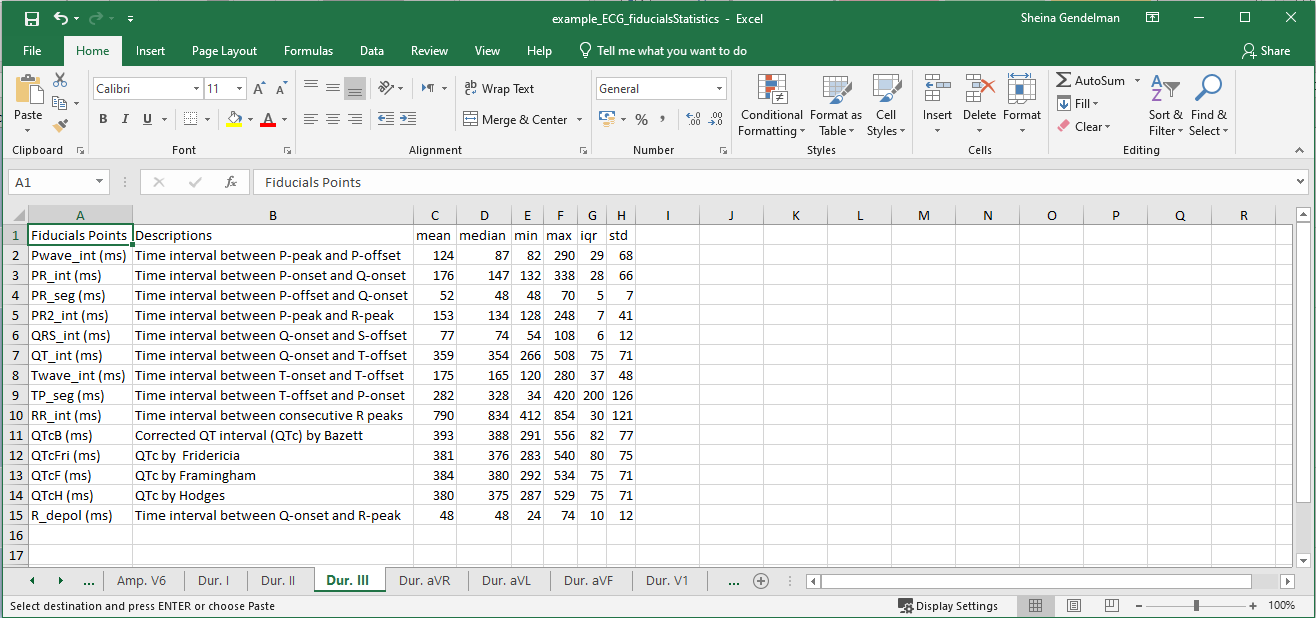
For multilead anlysis only the median of each biomarker will be presented in the table, while for single lead anlysis 6 statistical mesurment computed over the selected window (defined by W.S. W.L.) will be presented for each biomarker namely: mean, median, min, max. IQR and std.
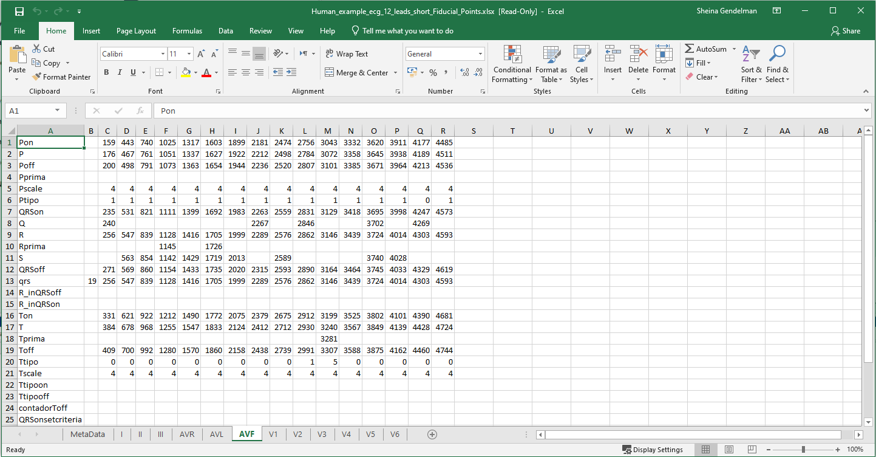
Exporting fiducial points
You can export the fiducial points. Go to File -> Save fiducial points. The excel file contains the computed fiducial points for each lead.
Exporting morphological biomarkers
You can export the morphological biomarkers. Go to File -> Save fiducial biomarkers. The excel file contains the engineered ECG biomarkers for each lead.